|

Weekly Market Guide
| Last Week in Review: Key housing and
jobs data was released. Plus a surprising read on Gross Domestic Product, the
broadest measure of economic activity. Forecast for the Week: This week's economic calendar is light, featuring readings on retail sales, jobless claims and wholesale inflation. View: See the important time tip that can make all the difference any time of year. |
| Last Week in Review |
"Tomorrow is often the busiest day of the
week." Spanish Proverb. And it sure seemed that way with last week's busy
economic calendar, as Friday's Jobs Report capped off a week filled with data.
Here are the highlights. 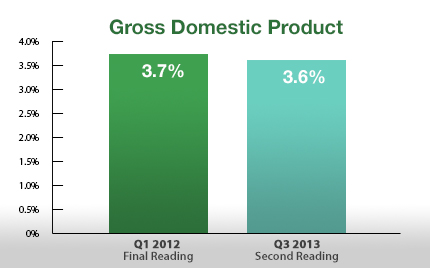 The
highly anticipated November Jobs Report revealed that employers created 203,000
jobs last month, above the 188,000 expected. The Unemployment Rate fell to a
5-year low of 7 percent while the Labor Force Participation Rate (LFPR) managed
to tick up to 63.0 percent, though it is still at lows not seen since the late
1970s. The LFPR is a measure of how many people are looking for work. All in all
this was a good report, but the labor market is not out of the woods yet. The
highly anticipated November Jobs Report revealed that employers created 203,000
jobs last month, above the 188,000 expected. The Unemployment Rate fell to a
5-year low of 7 percent while the Labor Force Participation Rate (LFPR) managed
to tick up to 63.0 percent, though it is still at lows not seen since the late
1970s. The LFPR is a measure of how many people are looking for work. All in all
this was a good report, but the labor market is not out of the woods yet.
Also of significance, the second reading of third quarter Gross Domestic Product (GDP) rose by 3.6 percent, above expectations and the best level in a year and a half. But a closer look shows the gains coming from a large buildup in inventories. This is important to note because a buildup in inventories could cause goods to stay on the shelf and not materialize into sales, which could set the stage for a disappointing read in the fourth quarter. In housing news, research firm CoreLogic reported that home prices, including distressed sales, rose by 12.5 percent in October 2013 compared to October 2012. This marks the twentieth month of year-over-year home price gains. In addition, New Home Sales for September fell but October's New Home Sales surged 26 percent, coming in above expectations. Both reports were delayed due to the government shutdown. What does this mean for home loan rates? Remember that the Fed has been purchasing $85 billion in Bonds and Treasuries each month to stimulate the economy and housing market. The Fed has said that its decision regarding when to taper these purchases will be dependent on economic data. Whether data has been strong enough for the Fed to begin tapering these purchases after its meeting of the Federal Open Market Committee on December 17-18 remains to be seen. Either way, the timing of the Fed's decision will definitely impact home loan rates heading into 2014 and it's why economic data in the coming weeks will be important to monitor. The bottom line is that now remains a great time to consider a home purchase or refinance as home loan rates remain attractive compared to historical levels. Let me know if I can answer any questions at all for you or your clients. |
| Forecast for the Week |
Economic data is light this week and doesn't
kick off until Thursday.
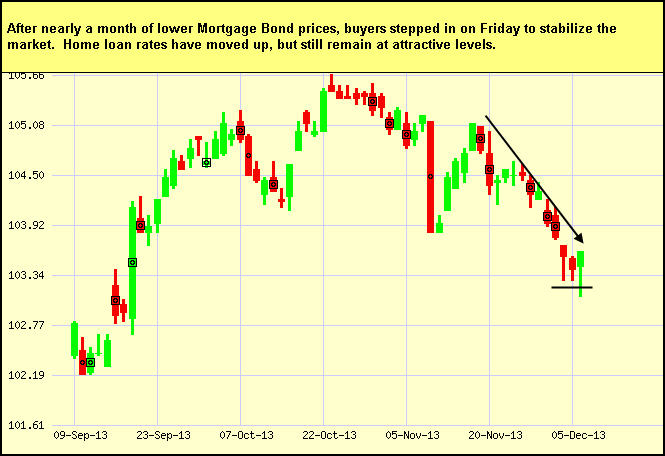
When you see these Bond prices moving higher, it means home loan rates are improving — and when they are moving lower, home loan rates are getting worse. To go one step further — a red "candle" means that MBS worsened during the day, while a green "candle" means MBS improved during the day. Depending on how dramatic the changes were on any given day, this can cause rate changes throughout the day, as well as on the rate sheets we start with each morning. As you can see in the chart below, Bonds and home loan rates have worsened in recent weeks, as some positive economic reports have caused concern that the Fed will taper its Bond purchases sooner rather than later. I will continue to monitor this story for all the latest developments.
Chart: Fannie
Mae 4.0% Mortgage Bond (Friday Dec 06, 2013)
 |
No comments:
Post a Comment